The point of no return in vetoing self-initiated movements /
PNAS
LİNK
The point of no return in vetoing self-initiated movements
- Matthias Schultze-Krafta,b,c,1,2,
- Daniel Birmana,d,1,
- Marco Rusconia,d,
- Carsten Allefelda,d,
- Kai Görgena,d,
- Sven Dähnee,
- Benjamin Blankertza,b,c, and
- John-Dylan Haynesa,c,d,f,g,h,2
Author Affiliations
-
Edited by William T. Newsome, Stanford University, Stanford, CA, and approved November 4, 2015 (received for review July 10, 2015)
Significance
Many studies have shown that movements are preceded by early brain signals. There has been a debate as to whether subjects can still cancel a movement after onset of these early signals. We tested whether subjects can win a “duel” against a brain–computer interface designed to predict their movements in real time from observations of their EEG activity. Our findings suggest that subjects can exert a “veto” even after onset of this preparatory process. However, the veto has to occur before a point of no return is reached after which participants cannot avoid moving.
Abstract
In humans, spontaneous movements are often preceded by early brain signals. One such signal is the readiness potential (RP) that gradually arises within the last second preceding a movement. An important question is whether people are able to cancel movements after the elicitation of such RPs, and if so until which point in time. Here, subjects played a game where they tried to press a button to earn points in a challenge with a brain–computer interface (BCI) that had been trained to detect their RPs in real time and to emit stop signals. Our data suggest that subjects can still veto a movement even after the onset of the RP. Cancellation of movements was possible if stop signals occurred earlier than 200 ms before movement onset, thus constituting a point of no return.
It has been repeatedly shown that spontaneous movements are preceded by early brain signals (1⇓⇓⇓⇓⇓⇓–8). As early as a second before a simple voluntary movement, a so-called readiness potential (RP) is observed over motor-related brain regions (1⇓–3, 5). The RP was found to precede the self-reported time of the “‘decision’ to act” (ref. 3, p. 623). Similar preparatory signals have been observed using invasive electrophysiology (8, 9) and functional MRI (7, 10), and have been demonstrated also for choices between multiple-response options (6, 7, 10), for abstract decisions (10), for perceptual choices (11), and for value-based decisions (12). To date, the exact nature and causal role of such early signals in decision making is debated (12⇓⇓⇓⇓⇓⇓⇓–20).
One important question is whether a person can still exert a veto by inhibiting the movement after onset of the RP (13, 18, 21, 22). One possibility is that the onset of the RP triggers a causal chain of events that unfolds in time and cannot be cancelled. The onset of the RP in this case would be akin to tipping the first stone in a row of dominoes. If there is no chance of intervening, the dominoes will gradually fall one-by-one until the last one is reached. This has been coined a ballistic stage of processing (23, 24). A different possibility is that participants can still terminate the process, akin to taking out a domino at some later stage in the chain and thus preventing the process from completing. Here, we directly tested this in a real-time experiment that required subjects to terminate their decision to move once a RP had been detected by a brain–computer interface (BCI) (25⇓⇓⇓⇓⇓–31).
Results
Subjects were confronted with a floor-mounted button and a light presented on a computer screen. Once the light turned green (“go signal”), subjects waited for a short, self-paced period of about 2 s after which they were allowed to press the button with their right foot at any time. They could earn points if they pressed while the light was green, but lose points if they pressed after the light had turned red (“stop signal”). The experiment had three consecutive stages (Fig. 1A). In stage I, stop signals were elicited at random onset times (sampled from a uniform distribution); thus, the movements were not being predicted. The EEG data from stage I were then used to train a classifier to predict upcoming movements in the next two stages of the experiment. In stage II, movement predictions were made in real time by the BCI with the aim of turning the stop signal on in time to interrupt the subject’s movement. The term “prediction” will be used here to denote any above-chance level of predictive accuracy, not only perfect prediction. After stage II, subjects were informed that they were being predicted by the computer and that they should try and move unpredictably, and another otherwise-identical stage followed.
Fig. 1.
Experimental design and possible trial outcomes. (A) The experiment consisted of three consecutive stages. During stage I, the stop signals were random. After stage I, a classifier was trained on button presses from stage I and the BCI predictor was activated. In the subsequent stages II and III, stop signals were elicited in real time by the BCI predictor. After stage II, subjects were informed about the predictor and instructed to try and move unpredictably. (B) Possible trial outcomes (see main text).
The mean waiting time between trial start and electromyogram (EMG) onset across subjects and stages was 5,441 ms. The mean movement duration from EMG onset to button press across subjects and stages was 316 ms. There was no significant effect of stage on waiting time [F(2,18) = 3.36, P = 0.06], but a significant effect of stage on movement velocity [F(2,18) = 9.86, P = 0.0013], such that movements were faster in stages II and III (see SI Appendix, Fig. S1, for details on stages).
Fig. 2 shows average RPs, EMG signals, and button press times. During all of the experimental stages, the event-related potential time-locked to EMG onset showed the typical exponential-looking RP with a peak over channel Cz (2). The RP was not lateralized at any time, which is to be expected for foot movements (32) where the cortical motor representation is on the medial wall. Despite the differences in experimental conditions, there was no significant difference between RPs in the three stages (Fig. 2). Thus, the instruction given to subjects between stages II and III to use strategies to avoid prediction did not alter the shape of the RP. We further performed a qualitative assessment of the amplitude of the RP at EMG onset. For this, we used the cross-validated classifier output at EMG onset (for details see Experimental Procedures) as an estimate for RP amplitude, since both quantities are directly related. The amplitude of the RP at EMG onset showed a significant negative correlation both with waiting time (r = −0.10; P = 0.009) and with movement duration (r = −0.25; P < 0.001).

Fig. 2.
Mean readiness potential (RP), EMG activity, and button press distribution. The top panel shows the average squared EMG potential recorded at the right calf, averaged over all stages and subjects. The Inset on the Right shows the button press distribution relative to EMG onset, pooled across stages and subjects. The three colored lines in the bottom panel show the grand average RP at channel Cz, during individual stages of the experiment. For stage I missed button press trials were used, for stages II and III silent trials were used because these were not interrupted by the BCI (see text for details on silent trials). Individual RPs were averaged across subjects (colored shadings indicate SEM). The scalp topographies show the EEG potential of all recorded channels, averaged over three time intervals indicated by the shaded regions: [−550 −400] ms, [−150 0] ms, and [250 400] ms. There was no significant difference between RPs of the three stages [F(2,18) = 0.02, P = 0.97; F(2,18) = 0.12, P = 0.89; and F(2,18) = 0.20, P = 0.82, respectively].
Each trial could end in one of four possible ways (Fig. 1B): In the first case, a subject would press the button while the light was green without a RP being detected. We refer to these as “missed button press” trials. In this case, the participant won. A second case was when the computer detected the RP, turned on the stop signal, and the subject subsequently pressed the button within the next 1,000 ms. We term this a “predicted button press” trial. In this case, the computer has won the trial. Another possibility is that the BCI indicated a RP and elicited a stop signal but the subject did not press the button within 1,000 ms. Here, neither the participant won (because they did not manage to press the button without being detected) nor the computer won (because the participant did not move as the task required). At first sight, one might consider all of these trials as false alarms where the classifier indicated a movement while the participant had neither made a decision nor initiated a movement. However, it is also possible that the classifier detected a movement that was being prepared but that the participant was able to cancel in time. One such case would be if the participant started to move (as indicated by the EMG) but then did not complete the button press. We term this an “aborted button press” trial. A different possibility is that the stop signal was elicited but the participant showed no overt sign of movement. This could either result from a prepared movement being terminated at an early stage, which we call an “early cancellation.” Alternatively, this could reflect spurious or false-positive detection by the classifier, which we term a proper “false alarm.” As there is no observable difference between these latter two cases, we jointly refer to them as “ambiguous” or “early cancellation/false alarm” trials. Fig. 3 shows the proportion of trials that had these four outcomes, separately for stages I, II, and III:
-
i) Missed button presses: In stage I (black bars in Fig. 3) when stop signals were random, most trials (66.5%) end with an undetected button press, i.e., the subject wins. The proportion of these trials is substantially reduced in stages II and III when the classifier is active [31.9% and 30.8%, respectively; paired t(9) = 6.49, P < 0.001, and paired t(9) = 9.99, P < 0.001]. There is no difference in the number of undetected button press trials between stages II and III despite the fact that subjects were informed of being predicted and they were instructed to act unpredictably before stage III [paired t(9) = 0.33, P = 0.75].
-
ii) Predicted button presses: In stage I, a very small number of trials (1.2%) ends with a detected button press, i.e., a case where the (random) “classifier” has won. In contrast, during stages II and III, the proportion of such trials is strongly increased by a factor of around 18 [19.5% and 22.8%; paired t(9) = 5.52, P < 0.001, and paired t(9) = 7.19, P < 0.001].
-
iii) Aborted button presses: In stage I, aborted button presses occur very rarely (2.2%), a rate that substantially increased in stages II and III [15.2% and 16.3%; paired t(9) = 2.67, P = 0.025, and paired t(9) = 2.81, P = 0.020].
-
iv) Ambiguous (early cancellations or false alarms): These types of trials occurred with similar rates in stages I, II, and III (30.1%, 33.5%, and 30.0%) with no significant difference between stage I and stages II and III [paired t(9) = 0.77, P = 0.46, and paired t(9) = 0.023, P = 0.98].
Fig. 3.
Percentage of trial outcomes across stages for the four trial categories (as in Fig. 1B). All trial categories in one stage (bars of same color) add up to 100%. Shown is the average across subjects (error bars indicate SEM).
If one were to count any movement after a stop signal (whether completed or aborted) as a win for the BCI predictor, then the proportion of trials on which the BCI wins is considerably increased and there is no significant difference between subject wins and BCI wins in stages II and III [34.6% versus 39.1%; t(9) = −0.27, P = 0.79, and paired t(9) = −0.88, P = 0.39].
We also assessed how the timing of stop signals was related to movement onsets (as assessed by EMG). Fig. 4A (red) shows the distribution of stop signals in predicted button press trials. The vast majority of stop signals occurred after EMG onset; thus, when subjects had already begun to move but before the button was depressed. Here, the stop signal presumably came too late to prevent the subjects from finishing their movement and pressing the button. Fig. 4B (green) shows the distribution of stop signal times for aborted button press trials. Here, the stop signals occurred earlier (starting around 200 ms before EMG). Thus, when stop signals were presented at late stages of movement preparation subjects could not prevent beginning to move, even though they could abort the movement. There was a gradual transition between stop signal times where movements could be aborted and those where they could not be aborted (Fig. 4C). This presumably reflects a variability in trial-by-trial stop signal reaction times (24).
Fig. 4.
Distribution of BCI predictions time-locked to EMG onset (vertical line). The three panels show the distribution of stop signals timings in predicted button press trials (A, red) and in aborted button press trials (B, green). C (red and green) shows their joint distribution. The black distribution superimposed as outline in all three panels shows the stop signal distribution in silent trials adjusted to account for the imbalanced probability of a trial being silent (40%) or not (60%). All bins comprised intervals of 100 ms, and counts were pooled across stages II and III of all subjects. Please note that, in silent trials, the distributions refer to the first stop signals that would have been emitted.
There were hardly any cases where subjects moved despite being presented with stop signals earlier than 200 ms before EMG. This is interesting given that the RP onset occurred more than 1,000 ms before EMG onset (Fig. 2). One possibility is that some detections were made at this early stage but that participants were almost always able to cancel the movement completely. To assess how early predictions could be made in principle, independent of the presentation of a stop signal, we studied the behavior of the predictor when stop signals were omitted. For this, 40% of trials in stages II and III were “silent trials”: Here, when the BCI predicted a movement, the time was silently recorded but the stop signal was not turned on and the trial continued until the button was pressed. As Fig. 4 A–C (black distribution) shows, a majority of predictions also in silent trials occurred around movement onset. However, many silent predictions occurred more than 200 ms before movement onset, compatible with the early RP onset. These early predictions were not found for predicted button press trials (Fig. 4A, red) or aborted button press trials (Fig. 4B, green) when stop signals are active. Thus, had the stop signal been active for these early predictions, subjects might have been caught preparing a movement but been able to cancel preparation early enough to prevent any observable movement. Resolving this issue would directly address the question of whether trials with stop signals, but no overt movements, constitute early cancellations or false alarms, and thus help interpret this ambiguous trial category.
If a proportion of these trials indeed reflected early cancellations instead of false alarms, one might observe some signs of movement preparation given that movement-predictive signals have been proposed to start before a decision (19). However, testing for the presence of an RP in the ambiguous trials would be biased: The classifier was trained to detect a RP and thus a false alarm should exhibit an RP-like topography as well. Thus, we searched for an independent indicator of movement preparation on ambiguous trials that was not based on the RP. For this we chose the event-related desynchronization (ERD) that occurs before and during movements in particular frequency bands in the EEG (33). ERD and RPs have been shown to have different generators in the brain and thus provide different information, therefore making ERD an index for motor preparation that is independent of the RP (34). We trained a classifier on the power contrast in those bands and tested it on the ambiguous trials (for full information on methods and results, see SI Appendix, Fig. S2). In this independent ERD analysis, movement preparation was also detected in ambiguous trials, but not in the random stop signal trials from stage I. Thus, at least a subset of ambiguous trials had likely already reached movement preparation and thus were not false alarms, but rather early cancellations.
We also used a questionnaire after each stage to assess subjects’ experiences and strategies during the different sections of the experiment (see SI Appendix, Supplemental Methods and Results, for details). When asked about their strategies during stages II and III, they reported “not thinking about the movements” (5 of 10), “pressing earlier” (4 of 10), or “trying to be more spontaneous” (4 of 10). When asked about whether they felt a connection between actions and the control of the light, several subjects reported that thinking about the movement caused the interruption (i.e., the light turning to red). As mentioned above, the changes revealed by the behavioral analyses did not result in a modification of the recorded RP.
Discussion
Our findings extend an important line of experimental work on the nature of early brain activity preceding movements (4, 6⇓–8, 19). Movement or intention detection has been typically studied off-line (35), whereas to date only few have undertaken the approach in real time (9, 26, 36). Neural mechanisms for the inhibition of cued as well as voluntary actions have been previously found in lateral and medial prefrontal cortex (PFC), pre-supplementary motor area (pre-SMA) and insular cortex (37⇓⇓⇓–41). However, these inhibitory processes have not been directly linked to preparatory signals, and it has remained unclear whether subjects can intentionally override early brain signals. In contrast, our study combined aspects of real-time BCI with interruption studies (19, 42) and cancellation studies (24, 38, 39). Please note that our choices pertained to decisions “when” to move and “whether” to move, but it did not involve a choice between different responses (“what” choices; see ref. 43).
We found that the shape of the RP was not affected by the instruction. In stage III, when subjects were instructed to evade being predicted, the RP had the same shape as in the other stages (Fig. 2). This is compatible with previous reports that the shape of the RP is highly stereotypical across different experimental conditions (19, 23). When they were actively being predicted by the BCI, subjects “lost” the trial 50% more often, due to pressing the button after a stop signal had been shown (Fig. 3). The proportion of trials where subjects moved despite being presented with a stop signal increased about 18-fold. If not only completed movements but also partial movements are taken into account, the success rates of the BCI and of the subjects were even comparable. Please note that our design involved a self-paced or asynchronous BCI predictor (29, 30), which imposes certain limitations on accuracy compared with a BCI operating on fixed time intervals (SI Appendix, Supplemental Discussion).
Despite the stereotypical shape of the RP and its early onset at around 1,000 ms before EMG activity, several aspects of our data suggest that subjects were able to cancel an upcoming movement until a point of no return was reached around 200 ms before movement onset. If the stop signal occurs later than 200 ms before EMG onset, the subject cannot avoid moving. However, up until a second point of no return is reached (after movement onset), participants can still avoid completing the movement. Fig. 5 shows a hypothetical time line of events and stages leading up to a button press.
Fig. 5.
Summary model of results (see text for details). Abbreviations: BP, button press; EMG, electromyogram; ERD, event-related desynchronization; RP, readiness potential; SSRT, stop signal reaction time.
Baseline.
In a first stage, a person has not yet engaged in preparing for a movement. If a RP is detected at this stage, it is due to a false positive: a similarity between the RP shape and random fluctuations in brain activity. If a stop signal is elicited during this stage, this constitutes a false alarm. Please note that our data are agnostic as to whether the onset of the RP occurs before the preparation or not (see ref. 19).
Movement Preparation.
At some point, a person decides to move and starts movement preparation. If a stop signal is presented during this period, movement preparatory signals can be observed, for example, a RP or ERD, but there are no overt signs of movement (as indicated by the EMG). However, an explanation is needed to clarify why people cannot prevent themselves from moving if the stop signal is presented later than 200 ms before movement onset. This cannot reflect the conduction delay between primary motor cortex and the calf muscles controlling the movement of the foot, because this delay is much shorter, around 25–30 ms (44). Instead, it presumably reflects the time it takes between the physical onset of the stop signal and the time the stop signal can catch up with and cancel a prepared movement (indicated by “X” in Fig. 5). This so-called stop signal reaction time has been reported to be around 200 ms (24), which is compatible with our data. So the time around 200 ms before movement onset constitutes a point of no return (19, 23) after which the initiation of a movement cannot be cancelled, even if it might still be possible to abort the completion of the movement.
Movement Execution.
Once the efferent motor signals have reached the peripheral muscles, the person begins to move. In the early stages of this phase, it is still possible to abort the movement. As the movement progresses toward completion, this becomes less possible due to the stop signal reaction time. Aborting a movement at this stage constitutes a “late cancellation” because it occurs in time to prevent pressing the button but not in time to cancel signs of overt movement. Once a second, late point of no return is reached, the stop process cannot catch up with the go process in time to abort the completion of the movement and thus the button will be pressed.
A recent study by Schurger et al. (19) combined EEG with computational modeling in a Libet task with interruptions. They suggest that cancellation can occur at very late cortical stages up to around 150 ms before a movement. Previous work on event-related potentials has indicated that planned movements can be interrupted by stop signals until very late stages, even beyond central planning all of the way into motor execution (23). This has been taken to indicate that there is no final “ballistic” stage in the brain (or potentially even in the periphery) where a movement will necessarily unfold fully once triggered. Our data in contrast concur with those of Schurger and suggest that there is a point of no return around 200 ms before a movement after which the onset of a movement cannot be cancelled (even if it is still possible to alter the movement).
Schurger et al. (19) interpret the RP to reflect the leaky integration of spontaneous fluctuations in autocorrelated neural signals. The interpretation of our data are agnostic in this respect. For our purposes, it is sufficient that the RP (or in the model of Schurger a stochastically accumulated signal) is to some degree predictive of the subsequent movement. Also, within the Schurger model, the accumulation of a leaky integrator is predictive of the probability of emitting a response. The more signal has been accumulated, the higher the probability that it can cross the threshold over the next brief time period. What is particularly interesting about the study by Schurger et al. is that they identify the onset of the decision not with the onset of the RP but with the final stage when the RP crosses a threshold in movement-related brain regions (19, 45). This postpones the potential period during which a decision can be influenced toward the end of the RP. Our study is compatible with this and suggests that a decision to move can be cancelled up until 200 ms before movement onset. Please note that our study used interruptions to cancel movement plans, which allowed us to assess a potential point of no return. In contrast, Schurger et al. (19) used interruptions to trigger movements, which does not directly reveal whether a movement can still be cancelled.
It has been previously reported that subjects are able to spontaneously cancel self-initiated movements (13, 38). This has been referred to as a “veto” (13). The possibility of a veto has played an important role in the debate about free will (13), which will not be discussed further here. Note that the original interpretation of the veto was dualistic, whereas in our case veto is meant akin to “cancellation.” Our study did not directly address the question of which cortical regions mediate the cancellation of a prepared movement. However, many previous studies have investigated the neural mechanisms that underlie inhibition of responses based on externally presented stop signals (reviewed in refs. 39 and 41). Please note that, in contrast to stop signal studies, in our case the initial decision to move was not externally but internally triggered. Conceptually, this could be compared with a race (24) between an internal go signal and an external stop signal. Many stop signal studies have reported that inhibition of a planned movement is accompanied by neural activity in multiple prefrontal regions, predominantly in right inferior PFC (41). It has been proposed that right inferior PFC acts like a brake that can inhibit movements both based on external stimuli or on internal processes such as goals (41). Another region that has been proposed to be involved in movement inhibition is medial PFC; however, its role is more controversial. On the one hand, stop signal studies show that activity in medial PFC might not directly reflect inhibition (37). However, it seems to be involved in cancelling movements based on spontaneous and endogenous decisions rather than based on external stop signals (38).
To summarize, our results suggest that humans can still cancel or veto a movement even after onset of the RP. This is possible until a point of no return around 200 ms before movement onset. However, even after the onset of the movement, it is possible to alter and cancel the movement as it unfolds.
Experimental Procedures
Subjects.
We investigated 12 healthy, right-handed, naive subjects (7 females; mean age, 24.9; SD, 2.3 y). Two subjects (one male, one female) were removed directly after stage I because their low RP amplitudes yielded classifier accuracies near chance level. The experiment was approved by the local ethics board of the Department of Psychology (Humboldt Universität zu Berlin) and was conducted in accordance with the Declaration of Helsinki. All subjects gave their informed oral and written consent.
Task.
Subjects were seated in a chair facing a computer screen at a distance of ∼1 m. They were asked to place their hands in their lap and their right foot 1–2 cm in front of a 10 × 20-cm switch pedal (Marquardt Mechatronik) attached to the floor. The delay times between motor cortex and onset of EMG in the peripheral muscle (soleus) are well described and amount to around 25 ms (44), which is slightly slower than delay times for hand movements of 15 ms (46). However, depressing a pedal/button with the foot is a very standard effector. Especially to everyone driving a car, this foot movement is well learned due to its similarity to pressing the brake pedal in a motorized vehicle. It has also been studied in several BCI settings, e.g., in the context of emergency braking (47). The precise movement task consisted in lifting the foot from the floor and pressing the button as fast as possible and in a consistent way. Foot movements were chosen after piloting instead of hand movements because they yield larger RPs (32).
In the experiment, subjects played a novel game using aspects of interruption and stop signal tasks (19, 24, 38, 42). The framing of a game was chosen so that subjects would feel encouraged to generate spontaneous, endogenous movements before a stop signal from the predicting computer. The game was organized into three stages (each with two 10-min blocks), and each stage consisted of individual trials. Each subject performed an average of 326 trials during the whole experiment.
The start of a trial was signaled by the circle in the middle of the screen turning green. Subjects were instructed to wait for 2 s after the start cue, after which they could press the button at any time, unless the stop signal—indicated by the circle turning red—was shown. In that case, they were told to withhold any movements. Each trial could end either by an undetected button press or 1,000 ms after a stop signal was issued. In principle, this task design leads to four different types of trial outcomes (Fig. 1B). If the trial ends with the button press, the subject wins a point in the game and we refer to those as missed button press trials. If a stop signal is issued, there is a 1-s time window during which button presses are still possible before the trial ends. We distinguish between trials where the button is pressed during that interval, called predicted button press trials, or trials where the subject begins to move (as detected by the EMG) but does not press the button, called aborted button press trials, and finally trials where no overt movement at all occurs during that interval, grouped together in an ambiguous early cancellation/false alarm category. During stage I, stop signal times were randomly drawn from a uniform distribution in the interval 2–18.5 s after the trial start cue. During stages II and III, stop signals were triggered in real time by the BCI predictor trained beforehand. Furthermore, in these two stages, 40% of trials were randomly assigned as “silent.” These were always ended by the subject pressing the button because BCI predictions were recorded but the stop signal was turned off.
Before stage I, subjects were informed that the computer generated the stop signals “randomly” and that there was “no particular pattern.” No new information was provided to subjects before stage II, i.e., they were unaware of the change of the origin of stop signals. Before stage III, subjects were told that the computer was trying to predict them: “The computer will try to guess when you are about to move and interrupt you, the interruptions are based on your history of previous actions.” Subjects were asked not to test the system by making false or bizarre movements—with the new instruction that they should “try to be unpredictable.”
Questionnaire.
A questionnaire was used to collect information about each subject’s subjective experience (SI Appendix, Supplemental Methods and Results). After each stage subjects were asked two questions: “Did you use a particular strategy during the last round?” and “Did you feel there was a connection between your actions and the appearance of an interruption?” After stage III, subjects were asked three further questions: whether or not they felt predicted; how good the computer’s predictions were; and if predictions had improved or worsened since the last stage. At the end of the experiment, subjects were paid 10€ per hour and earned a bonus based on the number of points they earned.
Data Acquisition.
EEG was recorded at 1 kHz with a 64-electrode Ag/AgCl cap (64Ch-EasyCap; Brain Products) mounted according to the 10–20 system, referenced to FCz and rereferenced off-line to a common reference. In addition to the EEG, the right-calf EMG was recorded using surface Ag/AgCl electrodes to obtain the earliest measure of movement onset. The amplified (analog filters: 0.1, 250 Hz) signal was converted to digital (BrainAmp MR Plus and BrainAmp ExG), saved for off-line analysis, and simultaneously processed on-line by the Berlin Brain–Computer Interface (BBCI) (github.com/bbci/bbci_public) Toolbox. The Pythonic Feedback Framework (PyFF) (48) was used to generate visual feedback.
BCI Predictor.
For the BCI predictor used in stages II and III, a linear classifier was trained using segments of EEG data from missed button press trials in stage I. Two periods were defined as “movement” and “no movement”: The former were 1,200-ms-long segments preceding EMG onset, whereas the latter were 1,200-ms-long segments preceding the trial start cue. EEG data from those segments were averaged over 100-ms windows, resulting in 12 samples per window and channel. The samples from a subset of channels were concatenated and used as features to train a regularized linear discriminant analysis (LDA) classifier with automatic shrinkage (31). Channels in which the RP peak amplitude was above the mean RP amplitude across all channels were chosen as the subset; the number varied between 8 and 12 across subjects. EMG onset was determined by first rectifying the EMG signal and then detecting the time points exceeding a subject-specific threshold of 99.9% above baseline. The so-trained classifier was eventually used to make predictions of movements in real time during stages II and III. Every 10 ms, a feature vector was constructed from the immediately preceding 1,200 ms of EEG data and used as input to the classifier, generating a classifier output value every 10 ms. Please note that all timings of stop signals and classifier outputs pertain to a classifier that has access to information only backward in time, i.e., a classifier output at T = 0 ms integrates preceding information, but not subsequent information. Whenever the classifier output crossed a threshold, this was considered a prediction, the event time was recorded, and a stop signal was issued (except for silent trials). The classifier output threshold was determined individually for each subject after training of the classifier. For this, we performed a 10-fold cross-validation on missed button press trials from stage I and—mimicking the real-time predictor with a sliding window—computed the time of first threshold crossing of classifier output for different threshold values. We assumed that predictions earlier than the onset of the RP at 1,000 ms before movement onset likely represented false positives. Because we sought to predict subjects as early as possible, the threshold was chosen such that the number of predictions in the interval −1,000–0 ms with respect to movement onset was maximal. Average RPs were computed by averaging EEG segments time-locked to the time of EMG onset and baseline corrected to the mean between −2,000 and −1,800 ms.
Acknowledgments
We thank Robert Deutschländer and Lasse Loose for help in recording the data, and Gabriel Curio and Ulrich Kühne for valuable discussions. Support was provided by Grants 01GQ0850, 01GQ0851, and 01GQ1001C from the German Federal Ministry of Education and Research (BMBF) and by Grants SFB 940, KFO 247, and GRK 1589/1 from the German Research Foundation (DFG).
Footnotes
-
Author contributions: J.-D.H. conceived the study; M.S.-K., D.B., M.R., B.B., and J.-D.H. designed the experiment; M.S.-K. and D.B. performed research; M.S.-K., D.B., M.R., C.A., K.G., S.D., B.B., and J.-D.H. contributed new analytic tools; M.S.-K. and B.B. adapted the BBCI toolbox for this experiment; M.S.-K. and D.B. analyzed data; M.S.-K., D.B., and J.-D.H. wrote the paper; and M.R. and B.B. contributed to writing the paper.
-
The authors declare no conflict of interest.
-
This article is a PNAS Direct Submission.
-
Data deposition: EEG data have been deposited at bbci.de/supplementary/2015-PNAS-Veto.
-
See Commentary on page 817.
-
This article contains supporting information online at www.pnas.org/lookup/suppl/doi:10.1073/pnas.1513569112/-/DCSupplemental.
Freely available online through the PNAS open access option.
References
- ↵
- Kornhuber HH,
- Deecke L
(1965) Hirnpotentialaenderungen bei Willkürbewegungen und eurons Bewegungen des Menschen: Bereitschaftspotential und reafferente Potentiale. Pflugers Arch 284(1):1–17
.
- ↵
- Deecke L,
- Scheid P,
- Kornhuber HH
(1969) Distribution of readiness potential, pre-motion positivity, and motor potential of the human cerebral cortex preceding voluntary finger movements. Exp Brain Res 7(2):158–168
.
- ↵
- Libet B,
- Gleason CA,
- Wright EW,
- Pearl DK
(1983) Time of conscious intention to act in relation to onset of cerebral activity (readiness-potential). The unconscious initiation of a freely voluntary act. Brain 106(Pt 3):623–642
.
- ↵
- Coles MGH
(1989) Modern mind-brain reading: Psychophysiology, physiology, and cognition. Psychophysiology 26(3):251–269
.
- ↵
- Cui RQ,
- Huter D,
- Lang W,
- Deecke L
(1999) Neuroimage of voluntary movement: Topography of the Bereitschaftspotential, a 64-channel DC current source density study. Neuroimage 9(1):124–134
.
- ↵
- Haggard P,
- Eimer M
(1999) On the relation between brain potentials and the awareness of voluntary movements. Exp Brain Res 126(1):128–133
.
- ↵
- Soon CS,
- Brass M,
- Heinze HJ,
- Haynes JD
(2008) Unconscious determinants of free decisions in the human brain. Nat Neurosci 11(5):543–545
.
- ↵
- Fried I,
- Mukamel R,
- Kreiman G
(2011) Internally generated preactivation of single neurons in human medial frontal cortex predicts volition. Neuron 69(3):548–562
.
- ↵
- Maoz U,
- Ye S,
- Ross I,
- Mamelak A,
- Koch C
(2012) Predicting action content on-line and in real time before action onset—an intracranial human study. Advances in Neural Information Processing Systems 25: 26th Annual Conference on Neural Information Processing Systems 2012, ed Bartlett P (Curran Associates, Red Hook, NY), pp 881–889
.
- ↵
- Soon CS,
- He AH,
- Bode S,
- Haynes JD
(2013) Predicting free choices for abstract intentions. Proc Natl Acad Sci USA 110(15):6217–6222
.
- ↵
- Bode S, et al.
(2012) Predicting perceptual decision biases from early brain activity. J Neurosci 32(36):12488–12498
.
- ↵
- Maoz U, et al.
(2013) Predeliberation activity in prefrontal cortex and striatum and the prediction of subsequent value judgment. Front Neurosci 7:225
.
- ↵
- Libet B
(1985) Unconscious cerebral initiative and the role of conscious will in voluntary action. Behav Brain Sci 8:529–566
.
- ↵
- Lau HC,
- Rogers RD,
- Passingham RE
(2007) Manipulating the experienced onset of intention after action execution. J Cogn Neurosci 19(1):81–90
.
- ↵
- Matsuhashi M,
- Hallett M
(2008) The timing of the conscious intention to move. Eur J Neurosci 28(11):2344–2351
.
- ↵
- Haggard P
(2008) Human volition: Towards a neuroscience of will. Nat Rev Neurosci 9(12):934–946
.
- ↵
- Trevena J,
- Miller J
(2010) Brain preparation before a voluntary action: Evidence against unconscious movement initiation. Conscious Cogn 19(1):447–456
.
- ↵
- Haynes JD
(2011) Decoding and predicting intentions. Ann N Y Acad Sci 1224:9–21
.
- ↵
- Schurger A,
- Sitt JD,
- Dehaene S
(2012) An accumulator model for spontaneous neural activity prior to self-initiated movement. Proc Natl Acad Sci USA 109(42):E2904–E2913
.
- ↵
- Guggisberg AG,
- Mottaz A
(2013) Timing and awareness of movement decisions: Does consciousness really come too late? Front Hum Neurosci 7:385
.
- ↵
- Chiang T
(2005) What’s expected of us. Nature 436(7047):150
.
- ↵
- Marks LE
(1985) Toward a psychophysics of intention. Behav Brain Sci 8(04):547
.
- ↵
- De Jong R,
- Coles MG,
- Logan GD,
- Gratton G
(1990) In search of the point of no return: The control of response processes. J Exp Psychol Hum Percept Perform 16(1):164–182
.
- ↵
- Logan GD,
- Cowan WB
(1984) On the ability to inhibit thought and action: A theory of an act of control. Psychol Rev 91(3):295–327
.
- ↵
- Wolpaw J,
- Wolpaw EW
, eds (2012) Brain–Computer Interfaces: Principles and Practice (Oxford Univ Press, Oxford)
.
- ↵
- Blankertz B, et al.
(2006) The Berlin Brain–Computer Interface: Machine learning based detection of user specific brain states. J Univers Comput Sci 12(6):581–607
.
- ↵
- Krauledat M, et al.
(2004) Improving speed and accuracy of brain–computer interfaces using readiness potential features. Conf Proc IEEE Eng Med Biol Soc 6:4511–4515
.
- ↵
- Lew E,
- Chavarriaga R,
- Silvoni S,
- Millán J del R
(2012) Detection of self-paced reaching movement intention from EEG signals. Front Neuroeng 5:13
.
- ↵
- Fatourechi M,
- Ward RK,
- Birch GE
(2008) A self-paced brain-computer interface system with a low false positive rate. J Neural Eng 5(1):9–23
.
- ↵
- Borisoff JF,
- Mason SG,
- Bashashati A,
- Birch GE
(2004) Brain–computer interface design for asynchronous control applications: Improvements to the LF-ASD asynchronous brain switch. IEEE Trans Biomed Eng 51(6):985–992
.
- ↵
- Blankertz B,
- Lemm S,
- Treder M,
- Haufe S,
- Müller KR
(2011) Single-trial analysis and classification of ERP components—a tutorial. Neuroimage 56(2):814–825
.
- ↵
- Brunia CH,
- Voorn FJ,
- Berger MP
(1985) Movement related slow potentials. II. A contrast between finger and foot movements in left-handed subjects. Electroencephalogr Clin Neurophysiol 60(2):135–145
.
- ↵
- Pfurtscheller G,
- Aranibar A
(1979) Evaluation of event-related desynchronization (ERD) preceding and following voluntary self-paced movement. Electroencephalogr Clin Neurophysiol 46(2):138–146
.
- ↵
- Bai O,
- Vorbach S,
- Hallett M,
- Floeter MK
(2006) Movement-related cortical potentials in primary lateral sclerosis. Ann Neurol 59(4):682–690
.
- ↵
- Salvaris M,
- Haggard P
(2014) Decoding intention at sensorimotor timescales. PLoS One 9(2):e85100
.
- ↵
- Bai O, et al.
(2011) Prediction of human voluntary movement before it occurs. Clin Neurophysiol 122(2):364–372
.
- ↵
- Rubia K,
- Smith AB,
- Brammer MJ,
- Taylor E
(2003) Right inferior prefrontal cortex mediates response inhibition while mesial prefrontal cortex is responsible for error detection. Neuroimage 20(1):351–358
.
- ↵
- Brass M,
- Haggard P
(2007) To do or not to do: The neural signature of self-control. J Neurosci 27(34):9141–9145
.
- ↵
- Verbruggen F,
- Logan GD
(2008) Response inhibition in the stop-signal paradigm. Trends Cogn Sci 12(11):418–424
.
- ↵
- Rae CL,
- Hughes LE,
- Weaver C,
- Anderson MC,
- Rowe JB
(2014) Selection and stopping in voluntary action: A meta-analysis and combined fMRI study. Neuroimage 86:381–391
.
- ↵
- Aron AR,
- Robbins TW,
- Poldrack RA
(2014) Inhibition and the right inferior frontal cortex: One decade on. Trends Cogn Sci 18(4):177–185
.
- ↵
- Hughes G,
- Schütz-Bosbach S,
- Waszak F
(2011) One action system or two? Evidence for common central preparatory mechanisms in voluntary and stimulus-driven actions. J Neurosci 31(46):16692–16699
.
- ↵
- Brass M,
- Haggard P
(2008) The what, when, whether model of intentional action. Neuroscientist 14(4):319–325
.
- ↵
- Morita H, et al.
(2000) Differential changes in corticospinal and Ia input to tibialis anterior and soleus motor eurons during voluntary contraction in man. Acta Physiol Scand 170(1):65–76
.
- ↵
- Hanes DP,
- Schall JD
(1996) Neural control of voluntary movement initiation. Science 274(5286):427–430
.
- ↵
- Calancie B,
- Nordin M,
- Wallin U,
- Hagbarth KE
(1987) Motor-unit responses in human wrist flexor and extensor muscles to transcranial cortical stimuli. J Neurophysiol 58(5):1168–1185
.
- ↵
- Haufe S, et al.
(2011) EEG potentials predict upcoming emergency brakings during simulated driving. J Neural Eng 8(5):056001
.
- ↵
- Venthur B, et al.
(2010) Pyff - a pythonic framework for feedback applications and stimulus presentation in neuroscience. Front Neurosci 4(100):179
.

|
|
Internally Generated Preactivation of Single Neurons in Human Medial Frontal Cortex Predicts Volition /
Neuron
 |
|
Article
Internally Generated Preactivation of Single Neurons in Human Medial Frontal Cortex Predicts Volition
Summary
Understanding how self-initiated behavior is encoded by neuronal circuits in the human brain remains elusive. We recorded the activity of 1019 neurons while twelve subjects performed self-initiated finger movement. We report progressive neuronal recruitment over ∼1500 ms before subjects report making the decision to move. We observed progressive increase or decrease in neuronal firing rate, particularly in the supplementary motor area (SMA), as the reported time of decision was approached. A population of 256 SMA neurons is sufficient to predict in single trials the impending decision to move with accuracy greater than 80% already 700 ms prior to subjects' awareness. Furthermore, we predict, with a precision of a few hundred ms, the actual time point of this voluntary decision to move. We implement a computational model whereby volition emerges once a change in internally generated firing rate of neuronal assemblies crosses a threshold.
Highlights
► Progressive changes in firing rates precede self-initiated movements ► Medial frontal cortex units signal volition onset before subjects' awareness ► Prediction level is high (90%) based on neuronal responses in single trials ► Volition could arise from accumulation of ensemble activity crossing a threshold
Introduction
Volitional control is at the root of our notion of self (Haggard, 2008; Jeannerod, 2007; Laplane et al., 1977). Impairments in the ability to express or detect volitional output can be devastating. Although the nature of voluntary action is a centuries-old question, the study of its neuronal basis is exceedingly difficult as it involves a phenomenon intrinsic to an organism and invisible to an observer. The neuronal circuits and mechanisms underlying self-initiated behavior are poorly understood.
In contrast to reflex actions, cortical function is essential for volitional control of movements (Brass and Haggard, 2008; Desmurget and Sirigu, 2009; Haggard, 2008; Laplane et al., 1977). On the basis of neurological cases, electrical stimulation, scalp electroencephalography, neuroimaging studies, and animal neurophysiology, a network of structures in the parietal and premotor cortex has been shown to play a key role in volition. There is substantial evidence implicating the parietal and medial frontal lobes in the representation of intention and in initiation of self-generated motor activity. This evidence is derived from lesions in animals and in patients (Assal et al., 2007; Brinkman, 1984; Fourneret et al., 2002; Laplane et al., 1977; Sirigu et al., 2004; Sirigu et al., 1999; Thaler et al., 1995), physiological recordings (Haggard and Eimer, 1999; Libet et al., 1983; Shibasaki et al., 1980; Yazawa et al., 2000), magnetoencephalography (Erdler et al., 2000), electrical stimulation in humans (Desmurget et al., 2009; Fried et al., 1991; Lim et al., 1994), and neuroimaging (Farrer et al., 2008; Lau et al., 2004a, 2004b; Milea et al., 2007; Soon et al., 2008). Macaque studies have pinpointed early events in the planning of movement to neuronal populations in supplementary motor area (Pesaran et al., 2008; Romo and Schultz, 1992; Shima and Tanji, 2000; Tanji, 1994) and parietal areas (Andersen and Buneo, 2002; Maimon and Assad, 2006a, 2006b). It has been proposed that areas within parietal cortex (including Brodmann areas 39 and 40) may participate in conscious intentions (Andersen and Buneo, 2002; Assal et al., 2007; Desmurget and Sirigu, 2009; Farrer et al., 2008; Gold and Shadlen, 2007; Haggard, 2008; Sirigu et al., 1999, 2004). These areas also receive and process sensory input (Andersen and Buneo, 2002; Gold and Shadlen, 2007) and project directly to premotor cortex (Andersen and Buneo, 2002; Desmurget and Sirigu, 2009). It has been proposed that premotor areas are involved in unconscious internally generated voluntary action (Brass and Haggard, 2008; Desmurget and Sirigu, 2009; Haggard, 2008; Libet et al., 1983).
An intriguing line of research in humans has identified a readiness potential preceding volition (Deecke et al., 1969; Haggard, 2008; Haggard and Eimer, 1999; Libet et al., 1983; Matsuhashi and Hallett, 2008). Scalp EEG and MEG recordings have revealed changes in neural activity preceding awareness of volitional state by hundreds of ms (in some studies even seconds). Additionally, recent imaging studies have identified activity changes in medial prefrontal regions that are predictive of voluntary decisions (Haggard, 2008; Soon et al., 2008). Here, we examine the neuronal correlates underlying control of self-initiated movement in humans by using single neuron recordings to address whether neuronal activity is predictive of subjective awareness of motor behavior on a single trial basis. We take advantage of a rare opportunity to examine the function of the human frontal and temporal lobe at the neuronal level and millisecond temporal resolution while subjects report their subjective intentions. Over an interval of more than 1000 ms prior to subjects' awareness of the decision or urge to act, we show that there is a progressive recruitment of neurons that change their firing patterns either in an excitatory or an inhibitory manner. These neurons are predominantly located in the SMA proper, pre-SMA, and anterior cingulate, and their activity correlates with the emergence of self-generated intentions in single trials well before the subject becomes aware of his internal state. We propose a simple quantitative biophysical model for the emergence of self-initiated behavior from the activity of small populations of neurons.
Results
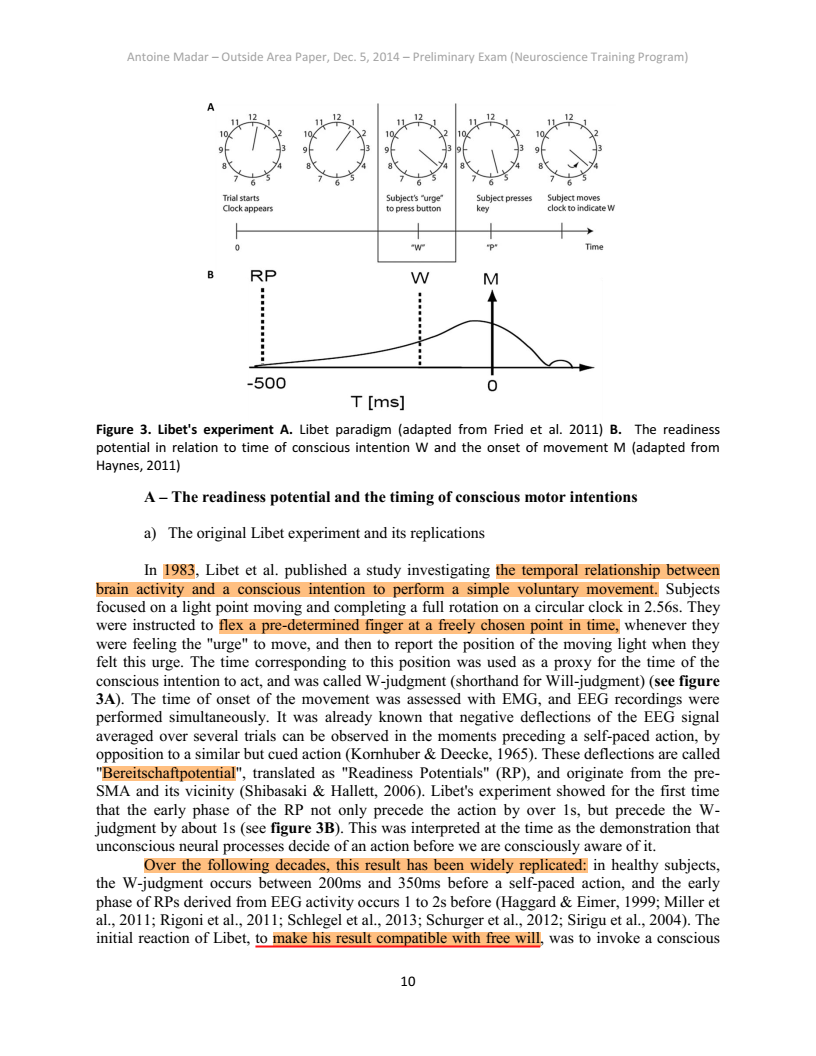
We studied 12 subjects with pharmacologically intractable epilepsy implanted with depth electrodes to localize the focus of seizure onset (Experimental Procedures). The electrode placement was determined exclusively by clinical criteria (Engel et al., 2005). We adopted a paradigm originally described by Libet and colleagues (1983). Subjects were presented with an analog clock depicted on a laptop and were instructed to fixate at the center (Figure 1A). A clock dial rotated on the screen with a period of 2568 ms. Subjects were instructed to place their right index finger on a key on the laptop keyboard, to wait for at least one complete revolution of the dial, and then press the key whenever “they felt the urge to do so” (3 subjects performed a variant of the task where they could also choose whether to use the right or left index finger). After pressing the key, the clock dial stopped and subjects were asked to indicate where the clock handle had been when they first felt the urge to move. We note that this “urge to move” can be interpreted as a decision for self-initiated movement. In each trial, we registered the time of key press (P) and the reported onset time of the “urge/decision to move” (W). The distribution of W and P times (Figures 1B and 1C) can be approximately fit by an exponential, which is consistent with a constant hazard function (Rausand and Hoyland, 2004) (as opposed to other strategies). There were very few trials in which the subjects pressed a button immediately after the first revolution of the handle (Figure 1C and see Figure S3A available online). The time between W and P was short and variable from trial to trial (Figure 1D). The W time reported by the subjects averaged at 193 ± 261 ms (mean ± SD) prior to key press (Figure 1D), similar to previous reports (Haggard and Eimer, 1999; Libet et al., 1983; Matsuhashi and Hallett, 2008). There is a lag of approximately 90 ms (93 ± 35 ms, mean ± STD) between the earliest detectable electromyographic (EMG) signal and the actual key press (Figures S3C and S3D).

- Download high-res image (301KB)
- Download full-size image
Figure 1. (A) Schematic diagram depicting the experimental paradigm (Libet et al., 1983). Subjects were shown an analog clock and were asked to press a key with their right index finger, at will, anytime after one rotation of the clock. After the key press event (“P”), the clock dial stopped and subjects were asked to indicate the time of onset of the “urge/decision” to press the key (“W”).
(B–D) Distribution of W times, P times and P-W across trials and subjects. Bin size = 100 ms (B, C) and 42.8 ms (D). The arrow shows the mean of the distribution (6071 ± 3005 ms; 6264 ± 3019 ms and 193 ± 261 ms, mean ± SD in (B), (C) and (D) respectively). Medians = 4964 ms, 5156 ms, 171 ms respectively. Ranges = [2795,19769] ms, [2795, 19812] ms, [43, 1455] ms respectively. W and P times are measured with respect to the trial onset time at t = 0. The vertical dashed line in (B) and (C) indicates the first revolution of the clock. These distributions and mean values are very similar to those reported in earlier implementations of the same paradigm (e.g., Haggard, 2008; Haggard and Eimer, 1999; Libet et al., 1983). The dotted line in (B) and (C) shows an exponential fit to the behavioral data. The coarse exponential fit suggests that the response hazard function is approximately uniformly distributed (Rausand and Hoyland, 2004).
See also Figures S2–S4.
We recorded the extracellular activity from a total of 760 units in the medial frontal lobe (264 single units (SUA) and 496 multiunits (MUA); e.g., Figures 2A and 2B) while subjects performed the task. Recorded regions include the supplementary and presupplementary motor area (SMA, and pre-SMA), and also the rostral and dorsal aspects of the anterior cingulate cortex (ACC) (Figures 2D and S6; Table 1; Experimental Procedures). We also recorded from 259 additional units in the temporal lobe (Table 1). The spike trains showed a coefficient of variation that was close to 1, similar to the one expected for a Poisson process and as previously shown for many other cortical neurons (Figure 2C). A sample of the recordings and the task is shown in Movie S1.

- Download high-res image (734KB)
- Download full-size image
Figure 2. (A and B) Example waveforms for five single units (A) and five multiunits (B). After spike sorting, units were classified into single units or multiunits according to the criteria described in (Tankus et al., 2009).
(C) Distribution of the coefficient of variation of the interspike interval distribution for MUA (red) and SUA (blue). The dashed lines indicate the mean of the distribution and the horizontal bars denote one standard deviation. All units in Table 1 are included here.
(D) Anatomical location of electrodes in the frontal lobe displayed on a Montreal Neurological Institute (MNI) brain (average of 305 brains) (Collins et al., 1994). Each electrode included eight recording microwires.
(E and F) Raster plots and histograms showing the responses of a neuron in left ACCd displaying a significant response after W (rank sum test, p < 10−6) (E), and one neuron in left pre-SMA with response onset prior to W (rank sum test, p < 10−3) (F). All plots are aligned to W (time = 0). Error bars indicate SEM (n = 63 repetitions). The green line in the PSTH denotes the average time of key press across all trials. Bin size for the PSTH = 100 ms.
See also Figures S2–S4 and S7.
Table 1. Anatomical Distribution of Responses (12 Subjects)
| Frontal Lobe |
ACCr |
ACCd |
pre-SMA |
SMA Proper |
Total |
| # of recorded cells |
197 (141 + 56) |
168 (111 + 57) |
232 (147 + 85) |
163 (97 + 66) |
760 (496 + 264) |
| Before W |
32 [16%] (23 + 9) |
26 [15%] (18 + 8) |
33 [14%] (18 + 15) |
37 [23%] (20 + 17) |
128 [17%] (79 + 49) |
| After W |
24 [12%] (15 + 9) |
22 [13%] (14 + 8) |
35 [15%] (22 + 13) |
17 [10%] (9 + 8) |
98 [13%] (60 + 38) |
| Temporal Lobe |
A |
H |
EC |
ST |
PHG |
Total |
| # of recorded cells |
24 (19 + 5) |
51 (34 + 17) |
127 (94 + 33) |
33 (31 + 2) |
24 (22 + 2) |
259 (200 + 59) |
| Before W |
2 [8%] (2 + 0) |
4 [8%] (3 + 1) |
9 [7%] (6 + 3) |
3 [9%] (3 + 0) |
2 [8%] (2 + 0) |
20 [8%] (16 + 4) |
| After W |
0 [0%] (0 + 0) |
7 [14%] (4 + 3) |
7 [6%] (5 + 2) |
8 [24%] (8 + 0) |
6 [25%] (1 + 5) |
28 [11%] (18 + 10) |
Total number of cells recorded, number (and percentages) of cells in each region responding prior to and after W (based on a rank sum test, p < 0.01, see Experimental Procedures). The numbers in parenthesis indicate the number of multi-units and single-units. SMA, supplementary motor area; ACCd, dorsal aspect of anterior cingulate cortex (including 20 postcentral units); ACCr, rostral aspect of ACC (including 26 medial cingulate units); A, amygdala; H, hippocampus; PHG, parahippocampal gyrus; EC, entorhinal cortex; ST, superior temporal gyrus (including four units in the temporal pole) (see also Tables S1 and S2 and Figures S1 and S6).
To assess whether or not units changed their firing rate in relation to the reported decision to move (W), we aligned the spike trains in each trial relative to W. Figure 2E depicts the activity of a single neuron in dorsal anterior cingulate cortex while the subject performed 63 trials of the task. This neuron increased its activity only after W, the reported onset of volition; in fact, the clearest change was after key press (green vertical line). A strikingly different pattern is exhibited by a neuron in the pre-SMA (Figure 2F), recorded simultaneously with the unit depicted in Figure 2E. This neuron increased its firing rate from a baseline of 4 Hz up to a peak firing rate of 12 Hz. This increase of firing rate commences about 700 ms before W, that is, well before the subject becomes aware of the decision/urge to move. In this example, the rise continues beyond the W point and past the key press, before it declines and returns to baseline.
Comparing the neuronal activity prior to W (400 ms interval) with the baseline firing rate (interval from −2500 to −1500 ms with respect to W; Experimental Procedures) we found that 128 out of the 760 neurons in the medial frontal lobe (17%) significantly changed their firing rate (rank sum test, p < 0.01; Table 1). This proportion is substantially greater compared to only 20 out of 259 (8%) in the temporal lobe (χ2(1) = 18.3, p < 10−4; Tables 1, S1, and S2). The number of units that showed changes in firing rate with respect to baseline in the frontal lobe was highly significant compared to different possible null hypotheses defined by either creating surrogate spike trains or by randomly shifting W (Figure S1A). In contrast, the number of units that showed changes in firing rate in the temporal lobe was comparable to the numbers obtained with surrogate spike trains (Figure S1B). In the medial frontal lobe, these changes were seen both in the SMA (pre-SMA and SMA proper) and in the ACC regions (dorsal and rostral aspects). The number of units that showed changes in firing rate was more than 3 standard deviations from the values expected by chance (and in many cases well above 5 standard deviations) for all four frontal lobe locations (Figures S1C–S1F, except for S1C2 and S1D3). The greatest proportion of neurons changing their activity before W (37 out of 163 neurons, 23%) was seen in the SMA proper (Tables 1 and S2). In addition to the neurons that changed their activity before W, another 98 out of 760 units (13%) in the medial frontal lobe changed their firing rate only after W. Such post-W changes were observed in similar proportions in the temporal lobe (28 units out of 259 [11%]; Table 1).
The average poststimulus time histograms (PSTHs) reveal a gradual change in firing rate (e.g., Figures 2E, 2F, 3, and 4A–4C). Gradual changes in the average PSTH could arise from either gradual changes in individual trials (Figure S2A) or from abrupt changes in individual trials with variable transition times (Figure S2B). To quantify the speed of firing rate changes in single trials, we fitted a logistic function to the spike trains after smoothing with a 200 ms Gaussian (Figure S2C). Upon examining individual trials, we find examples of relatively gradual transitions (e.g., Figure S2D) and examples of more abrupt transitions (Figure S2E). The average fitted parameters for all units are shown in Figures S2F and S2G revealing a wide range of abrupt/gradual responses in individual trials.

- Download high-res image (1MB)
- Download full-size image
Figure 3. (A–H) Examples of response profiles. (A–D) Neurons increasing their firing rates prior to W (p < 10−5, 10−5, 10−7, and 10−5, respectively). (E and F) Neurons decreasing their firing rates prior to W (p < 10−5, 10−4, respectively). (G and H) Neurons decreasing their firing rate prior to W and then increasing their firing rates around W (p < 10−3, 10−5, respectively). The conventions are as in Figures 2E and 2F.
(I–N). Examples of responses from several units that started to change their firing rate before the baseline period used in the text (−2500 to −1500 ms with respect to W). The responses are aligned to W (vertical black line); the vertical dashed line denotes the mean P. Only those trials where W occurred more than 5000 ms after the first turn of the clock are shown in the solid trace. The dotted trace shows all trials starting from 2500 ms before W (the solid curve and the dotted curves do not overlap perfectly because there are more trials averaged in the dotted curve; the number of trials is indicated on the left of each subplot). The location of each unit is indicated in each subplot. Error bars denote SEM and are shown only every 500 ms.
See also Figure S2–S4 and S7.

- Download high-res image (1002KB)
- Download full-size image
Figure 4. (A) Average normalized response profile of all neurons in the frontal lobe responding prior to W, separated by whether they increase (red) or decrease (blue) their rate as W is approached (referred to as “I” and “D,” respectively, in the text for increases or decreases in firing rate). For each neuron, the baseline activity (−2500 ms to −1500 ms relative to W) was subtracted. For units showing increased activity before W (red), the PSTH (bin = 100 ms) was normalized by the maximum firing rate and for units showing decreased neural activity before W (blue), the PSTH was normalized by the minimum firing rate. Note that the responses start well before the interval used to define units as “I” or “D” (in contrast to Figure S1G). Error bars denote SEM and are shown only every 500 ms for clarity.
(B) Average normalized response profile showing the temporal evolution of the responses for “I” (red) and “D” (blue) cells for MUA (left) and SUA (right).
(C1 and C2) Average normalized firing rate of all “I” cells (C1) and “D” cells (C2) responding prior to W in each medial frontal lobe region. This plot includes both MUA and SUA (cf. B). Error bars denote SEM and are shown only every 500 ms for clarity. (C3 and C4) Average normalized standard deviation of the firing rate of all “I” cells (C3) and “D” cells (C4) responding prior to W in each medial frontal lobe region. The format and conventions are the same as in (C1) and (C2). For each unit, we computed the standard deviation of the firing rate across trials in each time bin and we normalized by the maximum standard deviation across all time bins.
(D) Percentage of frontal lobe neurons with significant change in firing rate compared with baseline (rank sum, p < 0.01) as a function of time before W (Experimental Procedures). For each unit, we calculated the baseline firing rate in the window −2500 ms to −1500 ms relative to W (see Figure S3E for earlier definitions of baseline period). Next, we calculated the firing rate in a 400 ms sliding window (100 ms steps) starting at time −1500 ms to 0 ms and assessed significant changes from baseline using a rank sum test. The red and blue traces show the corresponding analyses restricted to MUA (red) and SUA (blue). The arrow indicates the percentage reported in Table 1. The horizontal dashed lines show the expected percentage (±SD) according to three different null models as described in Figure S1 (red = “Random W,” green = “Poisson,” blue = “ISI conserved”; Figure S1). The inset shows the corresponding data for the medial temporal lobe.
(E) Percent of neurons across brain regions with significant change in firing rate (compared with baseline) as a function of time before W.
See also Figures S4 and S7.
We observed two main patterns of firing changes in medial frontal neurons prior to W (Figures 3 and 4A–4C). The first was a progressive increase in the average firing rate commencing well before W illustrated by the examples in Figures 3A–3D and 3I–3K (“I units” for increase in firing rate). We observed rises beginning several hundreds of ms prior to W (Figures 3A–3C) or sometimes several thousands of ms prior to W (Figures 3I–3K), or rises with a steeper slope commencing closer to the W time point, e.g., ∼400 ms prior to W (Figure 3D). Rises sometimes persisted for several hundreds of ms beyond W (Figures 3A and 3B), while in other cases, activity sharply decreased around W or after movement (Figures 3C, 3D, and 3I–3K). The second pattern observed was a progressive decrease in the average firing rate with a similar temporal profile commencing several hundreds of ms prior to W (“D units” for decrease in firing rate, Figures 3E–3H and 3L–3N). In some cases, changes started several thousands of ms prior to W (Figures 3L–3N). Activity changes reached a plateau at W often near zero firing rate (Figures 3F and 3N) or increased at or near W (Figures 3G, 3H, and 3M). The average normalized response profile of all medial frontal lobe neurons responding prior to W (Figure 4A), demonstrates the gradual patterns of average firing rate increase and decrease prior to W. There was no significant difference between the baseline firing rates of “I” and “D” cells: 5.3 ± 4.5 Hz and 5.8 ± 5.5 Hz, respectively (mean ± SD; p = 0.3, one-tailed two-sample equal variance t test). These response patterns cannot be attributed to a mere selection bias of “I” units with high firing rates and selection of “D” units with low firing rates in the 400 ms before W (c.f. Figure S1G versus Figure 4A). Interestingly, the population average shows a reversal of the slope of responses just before W (100 to 200 ms) as exemplified by several of the individual examples (Figures 3C, 3I, 3J, 3K, 3G, 3H, and 3M). These pre-W patterns were observed both for MUA and SUA (Figure 4B). These response patterns were observed for the ACC (dorsal and rostral), pre-SMA, and SMA proper (Figures 4C1 and 4C2). In addition to the changes in mean firing rate we also observed parallel changes in the standard deviation of the firing rate (Figures 4C3 and 4C4). More details about the anatomical distribution of neurons increasing/decreasing their firing rates prior to W are provided in Table S1.
In parallel to the process of individual medial frontal neurons steadily altering their firing rates, the number of recruited neurons that change their activity compared to the baseline period (2500 to 1500 ms before W) also increased as W is approached (Figure 4D). Of the 760 medial frontal neurons recorded, 55 changed their firing rate relative to baseline already 1000 ms before W, while at the last 400 ms before W, this population increased to 128 neurons. Figure 4E depicts the temporal profile of neuronal recruitment in each of the anatomic regions recorded in the medial frontal lobe, showing greatest and earliest recruitment in the SMA proper.
Several aspects of this task have been subject of intense debate in the field (reviewed in Desmurget and Sirigu, 2009; Haggard, 2008; Shibasaki and Hallett, 2006; see also Joordens et al., 2002; Libet, 1985; Trevena and Miller, 2002 and comments therein). We open the discussion to these issues by providing several additional analyses and controls that were not possible before in the absence of single-unit responses. The number of recruited neurons depends on the baseline period. The definition of the baseline in this task has been a matter of considerable debate in the field. As illustrated by the examples in Figures 3I–3N, some units showed changes in firing rate before the 2500 to 1500 ms baseline period used in Table 1. As we push the baseline period to earlier times, the overall number of trials decreases (subjects rarely waited for more than three revolutions of the handle; Figures 1B and 1C). Using 5000 to 4000 ms before W as the baseline produces similar results to the ones reported here and reveals that many units show changes in firing rate several thousand ms before W (Figure S3E). It was not possible to use a baseline earlier than 10,000 ms because of insufficient number of trials (Figure 1B).
Key to this task is the volitional aspect of motor output; this has also been a matter of debate in the literature. It seems unlikely that subjects were “cued” by the clock handle completing the first revolution. First, as noted in the approximate exponential fits in Figures 1B and 1C, the hazard rate was approximately uniform which is indicative of the random variations in trial length (Rausand and Hoyland, 2004). Second, there were very few “cued” trials where subjects responded within 1500 ms of the first revolution of the handle (Figure S3A). Third, we did not observe any clear difference in the neurophysiological responses between those few trials where button press (P) < 1500 ms and those with P > 5000 ms after the first revolution of the clock (Figure S3B).
The close temporal correlation between W and P (Figures 1D, S3F, S3G, and S4) makes it difficult to dissociate these two time points. This tight temporal correlation makes sense within this task (there is no reason for subjects to feel the urge to move (W) and wait for a long time before executing the movement (P)). There were very few trials with a long interval between W and P (Figure 1D) and we did not observe any clear neurophysiological differences between those few trials with P − W > 600 ms and those with P − W < 300 ms (Figures S3F and S3G). To further examine whether the onset of neuronal activity changes was related to W and P, we estimated the response onset time in individual trials (Experimental Procedures; Figure S4A). Figure S4B shows several examples illustrating the tight correlation between W and the onset of firing rate changes in individual units and individual trials. The average correlation coefficient between W and the neuronal response onset time was 0.48 ± 0.45 (mean ± SD, median = 0.40, range = [−0.32,0.99]); the average correlation coefficient between P and the neuronal response onset time was 0.49 ± 0.42 (mean ± SD, median = 0.37, range = [−0.28,0.99]) (Figure S4C).
The subjective nature of W has also been called into question (e.g., Joordens et al., 2002). It is likely that there is a considerable degree of inaccuracy in reporting W. In an attempt to bound the inaccuracy in W, we considered two types of timing errors: time shifts and time jitter. To estimate the effect of temporal shifts on the results, we moved W in each trial by a fixed amount ranging from −1600 ms (that is, moving W 1600 ms earlier than the actual reported W) all the way to P (Figure S4D1) and repeated the previous analyses to compute the number of neurons that show changes in firing rate. We observed that small temporal shifts on the order of ±200 ms would still be compatible with the data. In fact, shifting W 50 ms earlier than the reported W actually increased the total number of responsive neurons. We speculate that this could reflect a systematic bias whereby subjects were late in reporting W. However, the results are not compatible with shifts in W of several hundred ms. To estimate the effect of temporal jitter in W, we moved W in each trial by a random amount taken from a Gaussian with zero mean and standard deviations ranging from 25 to 3200 ms (Figure S4D2). We observed that the number of responsive units would be close to the reported one with temporal jitters <200 ms but the results are not compatible with temporal jitters of several hundred ms. The analyses in Figure S4D put an approximate temporal bound on the accuracy of W. These results are consistent with the individual histograms showing variability in the peak response with respect to W (Figures 2E, 2F, and 3).
Figure 5A depicts the activity of 8 selected neurons from one experimental session (out of the 37 available units simultaneously recorded during this session) showing activity changes several hundred ms prior to W. Given the responses observed at the level of individual neurons prior to W, we hypothesized that the decision to perform the movement would depend on the concerted activity of ensembles of neurons such as the ones depicted in Figures 3 and 5A. Indeed, we could often record simultaneously from several neurons in different brain regions. We therefore asked whether we could decode W in single trials based on the activity of neuronal ensembles. To address this question we used a support vector machine (SVM) classifier (Hung et al., 2005). Given the activity of a population of neurons at a certain time, we first used the classifier to quantify how well we could discriminate activity before W from baseline activity in single trials (Experimental Procedures and Figure S5A). We started by decoding, on a trial-by-trial basis, the activity of individual neurons recorded during each experimental session. Although the activity of the “best” individual unit in this session, a neuron from right pre-SMA, yielded almost 60% discrimination performance already 500 ms prior to W, the “worst” unit in right anterior cingulate, or the average of all individual units in the population had close to chance performance at this time. We next considered an ensemble of 37 neurons consisting of all the units that were simultaneously recorded during this experimental session (Figure 5B). The population of neurons showed a distinct activity pattern that could be discriminated from baseline in individual trials better than chance well before the actual W time (e.g., 73% ± 2% accuracy at 500 ms before W, arrow in Figure 5B) and better than the best individual unit. Figures S5C–S5F show the performance of the classifier for individual subjects and different medial frontal lobe regions (Table S1).

- Download high-res image (270KB)
- Download full-size image
Figure 5. Discriminating Activity from Baseline on a Trial-by-Trial Basis using a Statistical Classifier
(A) Responses of eight units (each in a different color) during one experimental session. Only 15 trials, randomly selected from the 53 trials in this session, are shown here for each unit. The vertical dashed line indicates the W time.
(B) Performance of a support vector machine (SVM) classifier in distinguishing changes in population activity with respect to baseline. At each time point t with respect to W (vertical dashed line), we considered the response of each neuron during the interval [t − 200 ms; t + 200 ms]. We used a statistical classifier to assign the response of each neuron or each neuronal population as belonging to time t or the baseline period [−2500 ms; −2100 ms]. The y axis shows the performance of the classifier; the horizontal dashed line corresponds to chance performance obtained by random permutation of the training labels. We show the average performance level across all individual neurons in this session (gray). We next considered the entire ensemble of 37 units recorded during this experimental session (including single units and multiunits, 22 in SMA, 8 in ACC, 7 in the medial temporal lobe). The black curve shows the performance of the classifier based on the ensemble activity; the gray shaded region indicates SEM based on 100 crossvalidation steps (different random split of the data into a training set and a test set). In all cases, the reported performance levels are computed using test data not seen by the classifier during training. The two units illustrated in Figure 2 were recorded during this session and are therefore included in the analysis.
See also Figure S5.
We next constructed a pseudopopulation by considering units across all experimental sessions and subjects (Hung et al., 2005; Mehring et al., 2003). We note that there is significant variability across subjects (e.g., Table S1 and Figure S5D). At least partly, this variability can be accounted for by the different number of electrodes and recording locations across subjects. The pseudopopulation approach considers all electrodes independently of the subject and assumes independence in the responses from different electrodes. The performance of the classifier increases with the number of units and as W is approached (Figures 6A and S5E). As shown in Figure 6A, a pseudopopulation of 512 units pooled from across all frontal lobe regions yielded nearly 90% classification performance in identifying departure of neural activity from baseline 500 ms prior to W (and over 70% at 1000 ms before W; Figure S5E). In other words, 500 ms before the subject reports the first time of becoming aware of the decision to perform a movement, a linear decoding algorithm based on a small neuronal ensemble can detect significant changes in the population activity on 90% of the trials (and in 70% of the trials 1000 ms before W).

- Download high-res image (555KB)
- Download full-size image
Figure 6. Single-Trial Decoding of Response Changes from Neuronal Population Activity
(A) Performance of the decoding classifier using a pseudopopulation of varying number of units randomly sampled from the entire data set of 1019 units including both frontal and temporal regions. The horizontal dashed line indicates chance performance (50%). The red line corresponds to the classifier performance 1000 ms before W and the blue line corresponds to the classifier performance 500 ms before W as a function of the number of units used. The error bars indicate one standard deviation obtained by cross-validation from 100 random choices of the units and repetitions used for training the classifier. In all cases, the reported performance corresponds to test data not seen by the classifier during training.
(B) Comparison of decoding performance based on medial frontal (red) versus medial temporal (green) units (n = 180 units). Note the significant advantage of medial frontal neurons over medial temporal ones. The analysis is the same as in part (A) except that here we select specific regions that are used to train and test the decoder.
(C) Comparison of the decoding performance based on 150 SMA (green), 150 pre-SMA (blue), 150 rostral ACC (red), and 150 dorsal ACC units (black). The analysis and format are the same as in part (A). Note the higher classification performance of SMA over the other locations.
(D) Comparison of classification performance using units from the right hemisphere (green) versus units from the left hemisphere (red). The format and conventions follow the ones in part (A). A population of n = 268 units in each hemisphere was used (all locations combined). The horizontal dashed line shows chance performance level and the error bars were estimated by randomly shuffling the pre-W/baseline labels. The gray lines around the main curves show SEM over 100 cross-validation iterations.
(E) Comparison of classification performance using single units (red) versus multiunits (green). A spike-sorting algorithm was used to discriminate single units (SUA) from the recorded multiunit activity (MUA) and we automatically assigned clusters to SUA or MUA (Experimental Procedures). Here, we compare the decoding performance using single-units (red, n = 256) versus multi-units (green, n = 256) (all locations and hemispheres combined). The format and conventions follow the ones in (A). The horizontal dashed line shows chance performance level and the error bars were estimated by randomly shuffling the pre-W/baseline labels (one standard error over 100 cross-validation iterations).
(F) Comparison of classification performance using “I” cells (red, 50 units) versus “D” cells (blue, 50 units). In this figure, all locations are combined and SUA and MUA are combined. The format and conventions are the same as in (A).
See also Figure S5.
Since we recorded from neurons in several different brain regions (Table 1), we considered neuronal pseudopopulations coming from distinct brain locations (Figures 6B and 6C). Medial frontal lobe neurons clearly yielded higher classifier performance than medial temporal lobe neurons as expected based on the single neuron results (Figure 6B). For instance, decoding performance of 70% is reached by 180 medial frontal units 840 ms prior to W, while 180 temporal lobe neurons achieve 70% performance only 80 ms before W (arrows in Figure 6B). Within those neurons in the medial frontal lobe, neurons in SMA (including SMA-proper and pre-SMA) showed better decoding performance than the ACC units (Figure 6C). For instance, decoding performance of 70% is achieved using the activity of 256 SMA units 980 ms prior to W but only 480 ms prior to W when using the activity of 256 ACC units. Alternatively, at 500 ms prior to W, decoding performance using the activity of 256 SMA neurons is over 80% but only 70% when using the activity of 256 ACC units (Figure 6C). There was no significant difference in decoding performance when using activity from units in the left hemisphere (contralateral to the responding hand) versus units in the right hemisphere (Figure 6D). Additionally, the comparison of single units versus multiunits yielded similar decoding performance levels (Figure 6E). Decoding performance for “D” cells started earlier than for “I” cells (Figure 6F). Note that this earlier response for “D” cells is not apparent in Figure 4A emphasizing the importance of the population decoding approach as opposed to the averaging across units in Figure 4A.
Thus far, we have demonstrated that as W time is approached, we can reliably detect significant departures from baseline firing rate at the population level. Next, we tested how precisely we can predict the W time based on the neuronal activity. We used the SVM classifier to predict the time point at which the subject reported making the decision to move (Experimental Procedures; Figure 7). The algorithm detected the occurrence of W in 98% of the trials and only missed W in 2% of the trials. Figure 7D shows the distribution of predicted W times based on the activity of a pseudopopulation of 512 units. This relatively simple linear algorithm predicted W to occur, on average, 152 ms prior to the actual reported W (median = 100 ms prior to the reported W). There was a large spread around this mean, with a standard deviation of 370 ms. This spread seems to be consistent with our coarse estimations of the inaccuracies in the behavioral report of W times discussed above (Figure S4D). Overall, our linear algorithm relying on a small ensemble of neurons is able to predict a W time that is within a few hundred ms of the actual W time reported by the subjects.

- Download high-res image (172KB)
- Download full-size image
Figure 7. Predicting the Time of “Urge/Decision” Onset (W)
(A–C) An SVM algorithm was used to predict the time of “urge/decision” onset (W) based on the pseudo-population spiking data using 512 units. The activity of each unit was aligned to W to compare activity across different recording sessions and subjects. The classifier was trained to recognize whether W had been reached or not, using windows of size 400 ms (Experimental Procedures). The binary classifier was trained using 70% of the trials and its performance was tested on the remaining 30% of the trials. The analysis window was shifted from −3500 ms up to +1000 ms with respect to W. During testing, the predicted W time was defined as the first time point when 3 out of 4 consecutive windows yielded a label indicating the occurrence of W. (A) Single trial spike train example marking the position of the spikes and W. (B) Spike counts in windows of size tr = 400 ms. Gray rectangles denote windows where W occurred within a time tb ms. (C). Spike count windows overlapped by 100 ms.
(D) Distribution of the difference between the predicted time and W (the real W corresponds to t = 0 and is denoted here by the vertical dashed line). Bin size = 100 ms, n = 3963 trials (using cross-validation). The black and gray arrows denote the mean (−152 ms) and median (−100 ms) of the distribution, respectively (standard deviation = 370 ms). The dashed arrow indicates the mean value for a control case where training labels were assigned randomly (mean = 1153 ms, standard deviation = 995 ms). The fraction of missed trials (where the classifier could not detect W) was 2% (91% for the random label control case).
To examine whether the neuronal responses also represent information about the contents of volition, we recorded from 83 units (55 in medial frontal lobe and 28 in medial temporal lobe) in 3 additional subjects while they performed a variation of the task in which they not only chose the precise timing of the button press but also whether to press the button using their left or right hand (Haggard and Eimer, 1999). Some units showed a differential response depending on the hand choice (Figures S7B and S7C), whereas other units showed changes that were independent of the hand choice (Figure S7A). In most of the lateralized responses, the units showed a larger increase in firing rate when the subject chose the hand contralateral to the electrode's hemisphere. The neuronal population could extrapolate across hand choices to determine the volitional decision, as demonstrated by training the classifier to detect the onset of W using the neuronal responses from those trials in which subjects chose their right hand and testing the classifier's performance on those trials in which subjects chose their left hand (and vice versa) (Figure S7D). Additionally, the neuronal population contained information about the contents of the volitional decision as evidenced by training the classifier to identify which hand the subject opted to use (Figure S7E). We note that the weights for each unit are very different in Figure S7D versus Figure S7E. Taken together, the results in this small sample suggest that essentially all the SMA units showed progressive changes in average firing rate for both hand choices, some units showed a stronger response to contra-lateral hand choices, and the population of units could indicate W regardless of hand choices and also predict the hand choice well above chance levels.
Discussion
We present evidence that preconscious activity of small assemblies of single neurons in the medial frontal lobe not only precedes volition but can also predict volition and its time of occurrence on a single trial basis. The experimental paradigm used here to capture the volition timing has been, since its inception, a topic of lively debate (e.g., Libet, 1985, and comments therein). Variables such as attention, motor preparation, decision-making and intention have been invoked to explain early changes prior to W. The reporting of W is far from trivial, as subjects need to decide when they first felt the urge to move and then report it only later. However, our analyses show that inaccuracies of up to ∼200 ms in the report of W do not significantly change the number of neurons altering their activity before W (Figure S4D). We also showed that alternative definitions of the “baseline period” to the ones used in the text also yield similar conclusions (Figure S3E), that subjects were not performing “cued” movements (Figures 1D and S3A) and that there were no significant differences between short and long trials (Figure S3B). While these methodological considerations are pertinent, the early observations reporting scalp-recorded electroencephalographic readiness potential (Bereitschaftpotential) preceding volition (Colebatch, 2007; Deecke et al., 1969; Gilden et al., 1966; Libet et al., 1983; Shibasaki and Hallett, 2006) have been since replicated by several investigators and withstood the challenge of time (Haggard, 2005, 2008).
In human studies, it is difficult to make accurate timing estimates based on BOLD changes, and it is difficult to make accurate location estimates based on scalp signals. The study of volitional control in nonhuman primates presents a formidable challenge. Our study combines high spatial and temporal resolution and provides bounds for the spatial and temporal onset of volitional control. Our findings suggest a preconscious event observed at the single neuron level in the SMA prior to subjects' perceived urge to move. These findings bring to mind Eccles's sweeping hypothesis that “in all voluntary movements the initial neuronal event is in the supplementary motor areas (SMA) of both cerebral hemispheres” (Eccles, 1982). However, since our recordings were limited to regions of clinical interest, it is not clear that indeed the earliest neuronal event occurs at the SMA and not a different region we did no record from.
Some units show a progressive increase in average firing rate as W is approached whereas other units show a decrease in firing rate. These response patterns do not reveal anything about whether these units are excitatory or inhibitory. Within our sample, we find that the units recruited prior to volition are in regions of the medial wall of the frontal lobe, known to be involved in the planning, initiation, and execution of motor acts (Picard and Strick, 1996). The ramp up in activity that we describe here is reminiscent of similar slow changes in activity that have been observed in delay tasks in macaque monkeys in frontal and parietal cortex areas (e.g., Andersen and Buneo, 2002; Boussaoud and Wise, 1993; Freedman et al., 2001; Fuster, 2001; Gold and Shadlen, 2007; Maimon and Assad, 2006a, 2006b; Miller, 2000; Rainer et al., 1999; Romo et al., 1999; Romo and Schultz, 1992; Russo et al., 2002; Shima and Tanji, 2000; Tanji, 1994). Changes preceding W were significantly less frequent and robust in the temporal lobe where the neurons studied contributed little to the prediction of W (Figures 4D, 6B, and S1; Table 1). The changes in firing rate of medial temporal lobe neurons, particularly in the vicinity of W, may indicate their role in holding or recalling the handle's position in memory. Within the medial frontal lobe, higher performance in decoding volition is achieved earlier when decoding is based on SMA compared to ACC neurons. Numerous studies have implicated the SMA in the early representation of preparation for movement (Amador and Fried, 2004; Brinkman, 1984; Erdler et al., 2000; Fried et al., 1991; Ikeda et al., 2002; Laplane et al., 1977; Lau et al., 2004a, 2004b; Lim et al., 1994; Scepkowski and Cronin-Golomb, 2003; Shima and Tanji, 2000; Tanji, 1994; Thaler et al., 1995). A recent fMRI study (Lau et al., 2004a) showed activation of the SMA (albeit in pre-SMA rather than SMA-proper) when subjects attended to the timing of the intention to move, compared to the actual movement itself. In the current study, ACC neurons are also recruited several hundred ms prior to volition. Recent fMRI data showed that intentions covertly held by human subjects prior to overt response were best decoded by activity in mesial prefrontal cortex, an area which includes the rostral ACC (Haynes et al., 2007). In monkeys, single neuron activity prior to movement occurs also in the ACC, though later than in the SMA (Russo et al., 2002).
Our sample of recording locations is far from exhaustive. Other brain areas from which we did not record in the current study could also contribute to volition. Parietal areas show strong responses to cued movements, interpreted to represent the animal's motor intentions (Andersen and Buneo, 2002; Boussaoud and Wise, 1993; Cui and Andersen, 2007; Shenoy et al., 2003). Lateral intraparietal neurons exhibit firing rate elevation reaching a consistent value at the time of proactive, rather than reactive, arm movements (Maimon and Assad, 2006a). There is also significant evidence that links activity in the human parietal lobe to conscious intentions (Assal et al., 2007; Desmurget et al., 2009; Desmurget and Sirigu, 2009; Farrer et al., 2008; Sirigu et al., 2004; Sirigu et al., 1999). A recent study has shown striking evidence that electrical stimulation in parietal cortex elicited an urge to move and showed a dissociation between the effect of stimulation in parietal and premotor areas (Desmurget et al., 2009). In a rare opportunity, we recorded from 13 units in the right posterior parietal cortex in one subject. We observed 3 units (e.g., Figure S8) that showed pre-W increases in average firing rate (similar to Figure 3). The nature of the interaction between parietal and premotor cortex is an important question for future studies (Desmurget and Sirigu, 2009; Haggard, 2008).
In addition to a yes/no decision and its timing, a key aspect of volition is the possibility of deciding among multiple alternatives. This distinction has been formalized in the framework of characterizing the “what,” “when,” and “whether” of intentional action (Brass and Haggard, 2008). These different cognitive processes may be instantiated by separate neural circuits (Brass and Haggard, 2008; Lau et al., 2004a; Soon et al., 2008; Trevena and Miller, 2002). Here, we observed that several SMA neurons showed differential responses between hand choices (Figures S7B and S7C). In our small sample, those neurons showed stronger activation when subjects opted to use the contra-lateral hand, perhaps suggesting a role in motor preparation. Yet, we note that the neuronal responses started hundreds of ms (and sometimes even several seconds; Figure 3) before W. Also, while the subjects always used their right hand in the main variant of the task, we still did not see a difference in decoder performance when using the neural data from the right or left hemispheres (Figure 6D). These neurons still showed a progressive change in the response in those trials when subjects used the ipsilateral hand. Moreover, the classifier could extrapolate across hands (Figure S7). We can predict the volitional content (right versus left hand choice) from the population activity in SMA (Figure S7). Scalp recordings have shown that the readiness potential was not affected by hand choice but lateralized readiness potentials did show differences contingent on the hand choice (Haggard and Eimer, 1999; see also fMRI in Khonsari et al., 2007; Soon et al., 2008). Electrical stimulation studies point to contralateral biases in prevolitional responses (Fried et al., 1991; Desmurget and Sirigu, 2009). Laterality is a complex issue and the results reported in previous scalp EEG, fMRI, and electrical stimulation studies likely involve averaging over large numbers of neurons. The “overall” average activity may reveal more consistent contralateral biases than the neuronal responses described here.
Several hundreds of ms prior to volition, a neural process, explicit at the single neuron level, is set in motion. At the population level and also in several example units, activity peaks before W (Figures 3C, 3G, 3H, 3I, 3J, 3K, 3M, and 4A). As W time is approached, an increasing number of neurons are recruited (Figure 4D). Several studies have attempted to make a link between the neural events that precede W and the feeling of “will” (Brass and Haggard, 2008; Fourneret et al., 2002; Haggard, 2008; Libet, 1985; Soon et al., 2008; Trevena and Miller, 2002; Yazawa et al., 2000). The relationship between neural activity in cortex preceding motor output and the emergence of consciousness remains a topic of debate (Fourneret et al., 2002; Haggard, 2008). Although it remains unclear whether the emergence of volition is causally related to the neuronal changes described, the information conveyed by a small population of such neurons in the medial frontal lobe is sufficient to predict the onset of volition several hundreds of ms before subjects' awareness. This neuronal process suggests a mechanism whereby the feeling of will arises once integration of firing of recruited medial frontal neurons crosses a threshold (Gold and Shadlen, 2007; Libet et al., 1983; Matsuhashi and Hallett, 2008). Indeed an integrate-and-fire model that uses the medial frontal units as input could well implement this mechanism, reaching threshold within a few hundred ms of W (Figures S5G–S5I). While this is not a conclusive mechanistic proof or description of the neuronal circuitry involved in this task, this simple model suggests a potential biophysically plausible circuit for eliciting volitionally guided behavior that is consistent with our empirical observations and the ones from previous studies. Taken together, these findings lend support to the view that the experience of will emerges as the culmination of premotor activity (probably in combination with networks in parietal cortex) starting several hundreds of ms before awareness. The scientific, philosophical, and societal implications of these findings remain open for debate.
Experimental Procedures
Subjects and Recordings
The data in the current study come from 28 recording sessions in twelve patients with pharmacologically intractable epilepsy (eight right-handed; seven males; 15–46 years old). The patients were implanted with chronic depth electrodes for 7–10 days to determine the seizure focus for possible surgical resection. It should be kept in mind that these recordings come from patients with a neurological disorder; however, we note that most of the data are from regions that were found to be nonepileptogenic.
We report data from the following sites in the medial frontal lobe: supplementary motor area (SMA) corresponding to Brodmann's area 6, including SMA proper and the pre-supplementary motor area (pre-SMA) (Picard and Strick, 1996), anterior cingulate cortex (ACC) corresponding to Brodmann's area 24, including the dorsal ACC and the rostral ACC (McCormick et al., 2006). There are no definitive criteria to distinguish SMA and pre-SMA based on imaging; the border between SMA- proper and pre-SMA was determined at the level of the anterior commisure (VAC line) (Picard and Strick, 1996, 2001; Vorobiev et al., 1998). In addition, we recorded from neurons in the temporal lobe (Table 1). All studies conformed to the guidelines of the Medical Institutional Review Board at UCLA and all patients provided their consent to participate in the study. The electrode locations were based exclusively on clinical criteria and were verified by coregistering the postimplant CT image to the preoperative structural MRI using Vitrea (Vital Images Inc.). Due to the differences in the number and location of electrodes, there is considerable variability across subjects (e.g., Table S1 and Figure S5D). Each electrode probe had nine microwires at its end, eight recording channels and one reference (Fried et al., 1999). The differential signal from the microwires was amplified using a 64-channel Neuralynx system (Tucson, Arizona), filtered between 1 and 9000 Hz and sampled at 28 kHz. After spike sorting, the units were classified as “single units” or “multiunits” based on the automatic labeling criteria described in (Tankus et al., 2009) (e.g., Figures 2A and 2B).
Experiment Design
Subjects sat in bed facing a laptop computer depicting an analog clock. The clock handle rotated with a period of 2568 ms around the clock's circumference (clock tick = 42.8 ms). Subjects were instructed to place their right index finger on a key on the laptop keyboard, to wait for at least one complete clock revolution of the handle, and then press the key whenever they “felt the urge” to do so (Figure 1). Pressing the key (P) stopped the movement of the handle, and subjects were then asked to move the clock handle back to the spot where it had been when they first felt the urge to move. This point in time was referred to as the onset time of conscious free will (W). Trials were repeated in blocks of 25. Because of delays between index finger motion onset and the keyboard press, our measurement of P is delayed with respect to the actual motor onset (Figures S3C and S3D). The actual motion onset would be even closer to W than what we report in Figure 1D. Experimental trials that fulfilled any one of the following criteria were excluded from the analyses: (1) W and P times were the same (5% of the trials); (2) W time preceded P time by >1500 ms (<1% of the trials); (3) trial duration lasted > 20 s (3% of the trials); (4) Trials when the subject did not wait for one full rotation of the clock (10% of the trials); (5) one session from one subject was not considered further because there was only one good trial. These criteria are similar to those used in the original experiments by Libet and subsequent studies (Libet et al., 1983). The average number of trials per patient was 70 (range 25–128).
Three subjects performed a modified version of the task where they were allowed to choose not only the time of action but also which hand to use. These subjects could tap the keyboard with either their left or right index finger (Figure S7).
Spiking Activity
The raw data were band-pass filtered between 300 and 3000 Hz and thresholded for detection of potential spikes. Action potentials were clustered using a clustering algorithm and manually sorted as spikes or electrical noise (Quiroga et al., 2005). The classification between single unit and multiunit was performed automatically based on the criteria described in (Tankus et al., 2009).
Data Analysis
Classification of Individual Units
Firing rate was defined as the spike count in the (−2500, −1500) ms window (baseline) and in the −400 ms to 0 ms relative to W (pre-W) (Figure S3E). We compared firing rates using a non-parametric rank sum test and a threshold criterion of p < 0.01 (similar results were observed using a paired two-tailed t test). An analysis using a sliding window is presented in Figure 4. In Figure S1, we compared the changes in firing rate against those expected under three different null hypotheses (Supplemental Text). We classified the response of all 128 units responding significantly before W (Table 1) as either showing increase in firing rate with respect to baseline (“I,” n = 55) or decrease in firing rate with respect to baseline (“D,” n = 73). To plot Figures 4A–4C and S1G, the responses were normalized by subtracting the baseline activity and dividing by the maximum firing rate for “I” cells (or dividing by the absolute value of the minimum firing rate for “D” cells). After normalization, the responses were averaged.
Statistical Classifier
Figures 5–7 in the main text as well as Figure S4 use a support vector machine (SVM) (Hung et al., 2005) classifier to quantify whether the neuronal ensemble showed changes in their firing patterns before W. The classifier yields a measure of performance at the single-trial level, as opposed to the typical Bereitschaftspotential averaged over a large number of repetitions (Colebatch, 2007; Erdler et al., 2000; Haggard and Eimer, 1999; Libet et al., 1983; Ohara et al., 2006; Yazawa et al., 2000). In Figures 5 and S4, we asked whether the classifier could discriminate the neuronal responses from baseline activity at a time t prior to W (the Supplemental Text provides details about the classifier analyses). We used a cross-validation procedure whereby we randomly chose 70% of the trials for training and the remaining 30% of the trials were used to evaluate the classifier performance. Importantly, the performance of the classifier was evaluated with independent data that was not seen by the classifier during training (i.e., there was no overlap between the training and test data). The performance of the classifier at time t indicates the percentage of test trials correctly discriminated from baseline at a time t prior to W. Error bars in the classifier performance plots denote one standard error and are based on this cross-validation procedure. We also considered different subpopulations to train the classifier: right versus left hemisphere (Figure 6D), single units versus multiunits (Figure 6E), and different recording locations (Figures 6B and 6C).
Prediction of W Time
Figure 7 in the main text describes the performance of the classifier in predicting the time of volition onset (W). The procedure is described in the Supplemental Text.
Accuracy of W
Reporting W accurately is not trivial. Therefore, it is expected that there could be a variation between the reported W and the internal onset of the decision/urge to move. It is not easy to estimate this variability (Joordens et al., 2002). To quantify the impact of changes in W time on the spiking responses and our analyses, we simulated inaccuracies in W by adding a fixed temporal bias (Figure S4D1) or random jitter (Figure S4D2) to W.
Integrate-and-Fire Model
We speculate in the main text that the urge/decision may arise when a threshold is crossed after a cumulative increase in activity in the medial frontal lobe neuronal ensemble (Crick and Koch, 2003). The Supplemental Text describes an integrate-and-fire model that quantifies and implements this idea (Figure S5G–S5I).
Acknowledgments
The authors thank the patients for their cooperation in participating in the study. We also thank Eve Isham, Emily Ho, Kelsey Laird, Eric Behnke, Tony Fields, Sasha Kraskov, and Ariel Tankus. We thank David Freedman, Davide Zocolan, Robert Desimone, and John Maunsell for comments on the manuscript. This study was supported by a grant from NINDS (I.F.), NIGMS (G.K.), NEI (G.K.), NSF (G.K.), Klingenstein Fund (G.K.), Whitehall Foundation (G.K.), and a Human Frontiers Science Program Organization fellowship (R.M.).
|
|
|
|
|